For a while now there has been a lot of buzz and hype going around about Learning Analytics. It is being hailed as one of the next big thing in Learning and Development for at least 3 years now. Everybody claims that it can solve all your L&D problems, but what problems, how, and possibly most importantly, why?
I believe that one of the ways that Learning Analytics can contribute to Learning and Development is by how we set, track, and define KPI’s.
Let me paint you a picture. It is budget season and it is once again time for you to justify your budget. Justification usually entails reaching numbers that you sent out as targets a year ago. “People spent X hours on average training this year.” or “This division followed X number of classes this year.” or “We reached our KPI on hours spent learning this year!” or something along those lines.
Great, yes, so what’s the problem here? We already do that, do we not?
I am not arguing against KPI’s or using metrics, in fact I am all for it. However, I am questioning if most prevalent training KPI’s really are indicators for learning. Or are popular KPI’s just the best we can muster because we don’t know that we have anything else?
Sure, flashy dashboards with random numbers strewn across them might look nice and appealing, but they can be meaningless unless they are built on substance.
How do Learning Analytics result in KPI’s?
1. Discover and understand the data you have
Most organizations track training in some way or form and it is important to understand your data. When I say ‘understand your data’, I mean really dig into it. What is being tracked? How is it collected? How ‘clean’ is it?
For instance, every learning management system tracks a lot of learner behavior, but they don’t quite do it in the same way. A prime example of this is ‘log-in date’. Some LMS’s only track successful log-ins, and others track log-in attempts. However, either LMS will call it ‘log-in date’ but track two different things. Know your systems and know exactly what data the system collects and tracks.
2. Match the company’s strategy with the data
Selecting which data to use as our indicators is not an easy task. An indicator is an approximation for desired behavior. Therefore, I believe it be best to work backwards. Instead of picking out data and saying “This displays that behavior, we should track that!”, we should look at the company’s goals, think what behavior is beneficial to achieving those goals, and then look through the data we now understand to pick the best approximations for that behavior, or look into tracking new indicators of certain behavior.

3. Set a baseline
To know where you are going, it is important to understand where you are coming from. To set a baseline we need to clean and work the data we track through the magic of statistics. Raw but cleaned data is interesting and it can give you some basic insight, but is not useful for anything more than a gut feeling. Only when we start actually working on the data with statistics can we talk about its significance and meaning. This baseline is what we will compare future measurements to in order to track progress.
4. Set your KPI values based on your baseline
Now that you have your baseline set, you can set some realistic values on your KPI’s that will have value to your organization. Then when the next budget season comes around, it will be an easier discussion and not just a once a year exercise.
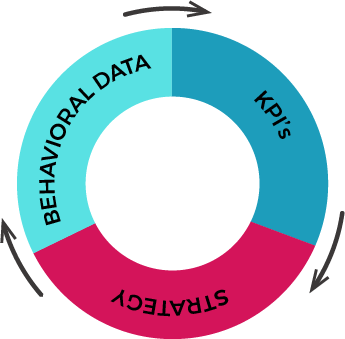
In essence the aim is to create a loop between the behavioral data you collect, the KPI’s you set, and your company’s strategy going forward.